
The eight schools in the Ivy League are among the most well-known and selective universities both within the US and in the world at large. Because of this, Ivy League (and similarly selective non-Ivy) schools have tens of thousands of students from whom to choose their class of 2026.
But what are Ivy League schools’ acceptance rates, and how have those rates changed over time? In this analysis, we’ll look at Ivy League admissions, from the number of applicants to the number of students who ultimately end up attending.
In addition to the eight Ivy League schools (Brown, Columbia, Cornell, Dartmouth, Harvard, Princeton, UPenn, and Yale), we’ll also consider eight equally selective non-Ivy League national universities: Caltech, Duke, Johns Hopkins, MIT, Northwestern, Stanford, UChicago, and Vanderbilt.
Ivy League Schools: Acceptance Rate Averages and Range
So what’s the most recent data on undergraduate Ivy acceptance rates? We’ve sleuthed out this information for you (from the 2021-2022 admissions cycle) and compiled it into a chart below.
| School | # Applied | # Admitted | % Admitted |
| Stanford* | 55,471 | 2,190 | 3.9% |
| Harvard | 61,220 | 1,954 | 3.2% |
| Columbia | 60,377 | 2,253 | 3.7% |
| Princeton* | 37,601 | 1,647 | 4.4% |
| Yale | 50,015 | 2,234 | 4.5% |
| UChicago* | 37,977 | 2,460 | 6.5% |
| Caltech* | 8,367 | 537 | 6.4% |
| MIT | 33,796 | 1,337 | 4.0% |
| Brown | 50,649 | 2,546 | 5.0% |
| Duke | 49,517 | 2,854 | 5.8% |
| UPenn* | 56,332 | 3,304 | 5.9% |
| Dartmouth | 28,336 | 1,767 | 6.2% |
| Northwestern | 51,554 | 3,609 | 7.0% |
| Vanderbilt |
46,717 |
3,162 | 6.8% |
| Johns Hopkins | 37,150 | 2,407 | 6.5% |
| Cornell* | 67,380 | 5,836 | 8.7% |
| Average (Overall) |
45,779 | 2,506 | 5.5% |
| Average (Ivies) |
51,489 | 2,693 | 5.2% |
*2022 data unavailable; 2021 data used instead
As you can see from the chart, for the most part the Ivy League and non-Ivy League schools are neck-in-neck as far as applicants, admitted students, and admission percentages go.
Harvard (with a 3.2% acceptance rate) was the most selective school in the 2021-2022 admissions cycle.
On the other end of the spectrum, the school with the highest acceptance rate is Cornell (8.7% undergraduate acceptance rate overall in 2020-2021).
When it comes to Ivy League admissions, though, this year’s acceptance rates are just a peek into the process. To predict what trends are going to look like for this future admissions seasons, we need more data. Below is a graph showing acceptance rates for Ivy League plus schools from 2014-2021, and in the following sections we go over admissions trends in more detail.
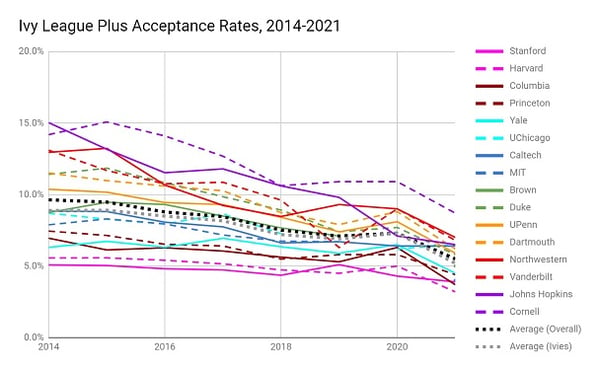
Data comes from schools’ publicly available Common Data Sets, the College Board’s BigFuture report of that data, or equivalent school pages.
Ivy League Admissions: 2014-2021
A disclaimer before we dive in: it’s true that past admission rates aren’t necessarily a sure-fire guarantee of what admissions rates will be like in the future for Ivy League (and other top-tier) schools. Cornell might decide that it wants to decrease its class sizes, causing its admissions rates to suddenly plummet; alternatively, students might decide they don’t want to apply to any schools with frat scenes, which would cause Ivy League admissions rates to spike.
But putting the unknowns of the future aside, it’s still helpful to look at Ivy League admissions trends over the last few years to get some idea of what to expect for this admissions season.
From looking at the graph above, you can see that admissions rates overall have trended downwards since 2014, with top schools becoming more and more selective. Based on the data we’ve collected, this trend is largely due to more students applying to schools, rather than schools accepting fewer students per year.
You can see how the number of applicants to each school has increased at roughly the same rate as acceptance rates have gone down (except for 2018) in the graph below.
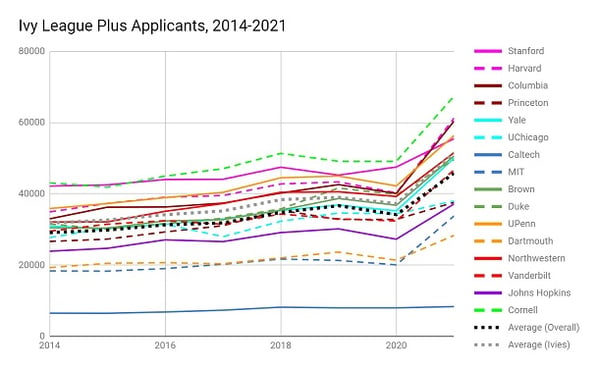
Data comes from schools’ publicly available Common Data Sets, the College Board’s BigFuture report of that data, or equivalent school pages.
Just by eyeballing this graph, it’s clear that, for most schools, the number of applicants has steadily increased, which then caused the acceptance rates to decrease.
The data from the last eight years also make it pretty clear that the decrease in acceptance rates is not at all caused by schools accepting fewer and fewer students each year. As the acceptance rate graph above showed, most Ivy-level schools have stable or even increased class sizes over time.
Pay attention in particular to the flatness of the dotted lines showing the average number of students admitted overall and to Ivy League schools in particular up through 2018. Aside from Yale, Northwestern, Johns Hopkins, and Cornell, every other school on the graph admitted around the same number of students over the course of five years.
Ivy League Admissions: 2018-2020
A new trend is that, compared to the 2018/2019 admission year, admission rates were actually slightly higher for the 2019/2020 admission cycle. This difference was small (typically less than half a percentage point), and it was often because schools received several thousand fewer applications than they had in 2018/2019. This is good news for people concerned that Ivy Leagues will keep getting more and more competitive each year. The number of students applying to colleges in 2018/2019 appeared to be unusually high, so it made sense that would also be the most competitive year each Ivy League school had seen. In 2019/2020, there appeared to be slightly fewer high school students, so schools received fewer applications, which made schools a bit easier to get into.
Now, whether Harvard admits 4.7% of students or 5% of students in a given year will likely have no impact on your chances, since the difference is so small. So don’t drive yourself crazy trying to estimate how many high school students there will be the year you apply.
By looking not just at Ivy League college acceptance rates over time, but also at the raw numbers of applicants and admitted students, it’s clear that there’s not a whole lot of variation in how many students Ivy League schools are accepting each year.
Most of what’s making Ivy-caliber schools more and more selective is the increased volume of students applying. There’s one final piece of the puzzle to discuss, though, and that is each school’s yield, or the percent of accepted students who decide to enroll at a college.
Ivy League Admissions: 2020-2022
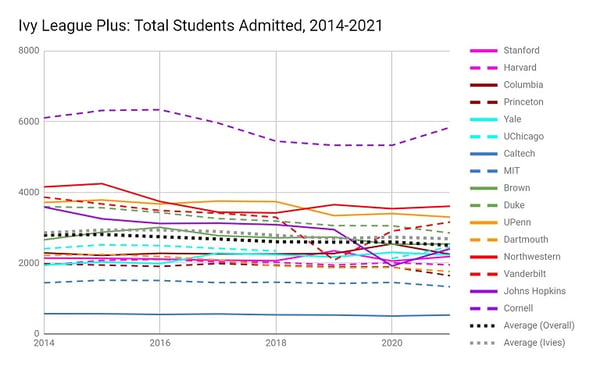
Data comes from schools’ publicly available Common Data Sets, the College Board’s BigFuture report of that data, or equivalent school pages.
The COVID-19 pandemic infiltrated every part of life, including college admissions. Many students who would have enrolled in college in Fall 2020 chose to defer for a year. There were many reasons for this, including wanting to stay closer to home during a pandemic, not feeling that remote learning was a good return on investment, and wanting to save money. As a result, many colleges, including Ivy Leagues, had to dig deep into their waitlists in the Spring of 2020, and acceptance rates rose slightly.
The 2021-2022 admissions cycle was when the greatest shift to date in college acceptance rates occurred. Many colleges, especially Ivy League and other top-tier schools, received significantly more applications than they ever had. This wasn’t a little increase; these schools were receiving thousands more applications than they ever had. For example, in 2019-2020, Harvard received 40,248 applications. In 2020-2021, they received 57,786. That’s a massive increase! This trend held true across all Ivy League schools. There are many potential reasons for this increase, including students who had postponed college now applying and the dropping of SAT/ACT requirements at nearly every school that perhaps convinced applicants they could have a shot at a school otherwise out of their reach.
Application numbers shot up, however; the number of students admitted remained roughly the same at each school. In fact, in many schools it even dropped a bit because those schools were holding spots for students who had deferred last year.
What was the impact of this? Acceptance rates plummeted to their lowest levels ever for many top-tier schools. Between 2019-2020 and 2020-2021, Harvard’s acceptance rate went from 5.0% to 4.0%, Yale’s went from 6.5% to 4.6%, and Columbia’s went from 6.3% all the way down to 3.9%, to give a few examples. On average, Ivy League acceptance rates went from 7.3% to 5.7%. These are far greater changes than the standard 0.2% or so we normally see year to year. This meant that, unfortunately, 2020-2021, as a whole, was the toughest year to date to get into an Ivy League or similar top-tier school.
For 2021-2022, this trend largely continued. Acceptance rates for top colleges either held fairly steady, or dropped even lower. Harvard’s acceptance rate dropped to 3.2%, the lowest we’ve ever seen from a college releasing its acceptance rate. Most schools still remained test optional, and many of these top-tier schools still had very high numbers of applications, with some even breaking their records from last year.
 Not that kind of yield.
Ivy League Undergraduate Enrollment
In the Ivy League admissions game, there are two main factors that schools care about. We already discussed one aspect of admissions to top-tier national universities, which is admissions rates (which depend on the number of applicants and number of students admitted).
The lower the admission rate, the more selective the school is seen as being (which leads to schools being higher-ranked, which leads to more people knowing about those schools and applying to them, which leads to lower admission rates…and so on).
Besides acceptance rates, the main other factor Ivy-level schools care about is their yield, or how many of the students admitted end up enrolling.
Schools want their yield to be high because it demonstrates that students really want to attend their schools. More desirable schools end up ranked higher, which drives more high-achieving students to apply to the schools, which allows the schools to have their pick of applicants.
Yield also informs acceptance rates. Based on years of admissions data, schools know almost exactly how many students they need to admit to get the class size that they want. The difference between knowing almost exactly how many students will enroll and the exact number is the reason for waitlists: if more students decline admission than expected, schools still need to fill their incoming freshman class.
As a general rule, the lower a school’s yield, the higher its acceptance rate. This usually happens because schools with lower yields need to admit more students (AKA have a higher acceptance rate), since a lower percentage of those accepted will attend.
So how does this play out in the Ivy League Plus admissions field? While Ivy acceptance rates don’t vary a huge amount (from Harvard’s 3.2% to Cornell’s 8.7%), the yield rates of Ivy League schools vary quite a great deal.
Let’s look at a chart of the yield for all students enrolling in Ivy League-caliber universities for Fall 2021.
| School | % Admitted | # Admitted | # Attending | Yield |
| Stanford | 3.9% | 2,190 | 2,126 | 97.1% |
| Harvard | 4.0% | 2,320 | 1,968 | 84.8% |
| Columbia | 3.9% | 2,358 | 1,569 | 66.5% |
| Princeton | 4.4% | 1,647 | 1,345 | 81.7% |
| Yale | 4.6% | 2,169 | 1,789 | 82.5% |
| UChicago* | 6.2% | 2,133 | 1,457 | 68.3% |
| Caltech* | 6.7% | 536 | 244 | 45.5% |
| MIT | 4.1% | 1,365 | 1,184 | 86.7% |
| Brown | 5.4% | 2,537 | 1,724 | 68% |
| Duke | 5.8% | 2,854 | 1,752 | 61.4% |
| UPenn | 5.9% | 3,304 | 2,321 | 70.2% |
| Dartmouth | 6.2% | 1,749 | 1,229 | 70.3% |
| Northwestern | 6.8% | 3,239 | 2,100 | 64.8% |
| Vanderbilt | 6.7% | 3,162 | — | — |
| Johns Hopkins* | 7.1% | 1,922 | 1,300 | 67.6% |
| Cornell | 8.7% | 5,836 | 3,750 | 64.3% |
| Average (Overall) | 5.7% | 2,458 | 1,696 | 72% |
| Average (Ivies) | 5.4% | 2,740 | 1,962 | 73.5% |
*2021 data not yet available; 2020 data used instead
Unlike the fairly small range of Ivy League Plus acceptance rates, the yield rates for Ivy League Plus schools range from the lowest yield rates, Caltech’s 45.5%, to the over doubly-high yield rate of Stanford (97.1%).
In other words, in Fall 2021, relative to the number of students admitted, over twice as many first-year students enrolled at Stanford as at Caltech.
Because Stanford’s admission rate is a couple of percentage points lower than Caltech (and because Stanford has a liberal arts undergraduate program, while Caltech is an engineering school), it makes sense that there would be a difference in yield rate between the two schools.
However, there are still some pretty startling gaps between school yield rates, even for schools with similar acceptance rates and academic focuses. For instance, MIT (4.1% admitted) had a yield of 86.7%, while Caltech (6.7% admitted) had a yield of 45.5%.
Are these trends consistent over time? Let’s look at yield for 2014-2018 for these same schools.
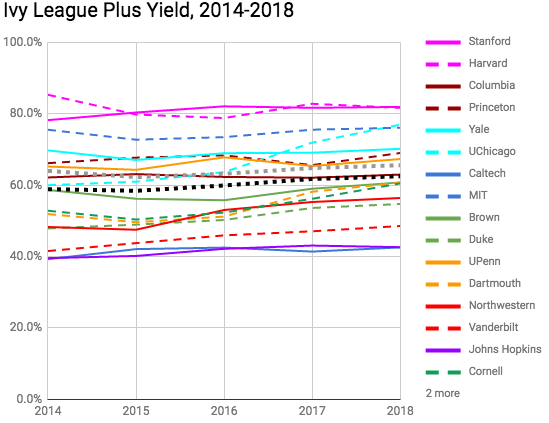 Data for 2014-2018 comes from schools’ publicly available Common Data Sets, the College Board’s BigFuture report of that data, or equivalent school pages.
Overall, for most of these top 16 schools, yield rate has gone up over the last few years. This indicates that not only are schools accepting fewer students each year, but more students are also accepting the offers of admission they can get.
However, unlike acceptance rate (which is very much within the control of the school), how many students decide to enroll after being admitted is much more dependent on the attitudes of the students admitted. Yield can be affected by factors as clearly related to enrollment as financial aid packages or as seemingly tangential to enrollment as a public exposé of a school’s toxic social atmosphere.
To make their yields more predictable, most top universities (including all the ones mentioned in this article) have some kind of early admissions policy (whether it’s early decision, restrictive early action, or just plain ol’ early action). In the next section, we’ll discuss how schools nail down their yields through these early admissions programs.
Want to get into Harvard or your personal top choice college?
We can help. PrepScholar Admissions is the world’s best admissions consulting service. We combine world-class admissions counselors with our data-driven, proprietary admissions strategies. We’ve overseen thousands of students get into their top choice schools, from state colleges to the Ivy League.
Learn more about PrepScholar Admissions to maximize your chance of getting in.

Yield and Early Admissions at Top Universities
Looking at applicant numbers over the years, it’s clear that Ivy League schools aren’t suffering from lack of choice when it comes to their applicant pool.
While it’s true that better-qualified applicants tend to apply early, there’s no doubt that any of the sixteen schools we’ve mentioned in this article could get rid of their early admissions program this year and still be able to fill their class of 2026 with eminently qualified students.
However, in addition to netting schools high-qualified candidates, early admissions programs also have the distinct benefit of boosting a school’s yield. Having binding early decision programs mean that before regular admissions starts, schools can be assured that they’ve already met anywhere from 20-50% of their yield goals. This early admissions yield boost can even carry over for schools which offer non-binding admission programs, also known as early action programs.
The chart below shows early admission stats for students who applied in Fall 2021. (Caltech, Princeton, Vanderbilt, University of Chicago, Columbia, Northwestern, and Stanford were omitted due to lack of data.)
| School | Early Applied | Early Admitted | Early Admit % | Total Admitted | Total % Admit |
| Harvard | 9,406 | 740 | 7.9% | 1,954 | 3.2% |
| Yale | 7,288 | 800 | 11.0% | 2,234 | 4.5% |
| MIT | 14,781 | 697 | 4.7% | 1,337 | 4.0% |
| Brown | 6,146 | 896 | 14.6% | 2,546 | 5.0% |
| Duke | 4,015 | 855 | 21.3% | 2,854 | 5.8% |
| UPenn | 7,795 | 1,218 | 15.6% | — | — |
| Dartmouth | 2,633 | 560 | 21.3% | 1,767 | 6.2% |
| Johns Hopkins | — | 821 | — | 2,407 | 6.5% |
| Average (Overall) |
7,438 | 823 | 13.8% | 2,157 | 5.0% |
| Average (Ivies) |
6,654 | 843 | 14.1% | 2,125 | 4.7% |
As you can see from this chart, early admission acceptance rates for most of these highly selective schools are double, or even triple, those for students applying regular decision (or deferred after early admission).
The takeaway from this is that if you’re a “borderline” admissions case, early admission might make the difference between being accepted and rejected.
A note of caution: early decision and early action admission rates being higher than regular admission rates are more a reflection of qualified students deciding they want to apply early than schools admitting students because they applied early. If you’re just applying to a school as a shoot-the-moon kind of chance, you’re not going to get admitted just because you applied early instead of regular decision.
However, if you’re “borderline” in some way (e.g. your test scores aren’t at the 75th percentile, or your GPA isn’t quite where you’d want it to be, but you’re otherwise qualified), applying early will give you your best shot at getting admitted to Ivy League Plus schools.

5 Tips to Boost Your Ivy League Admissions Chances
So far, we’ve gone through the hard data of Ivy League schools’ acceptance rates and yields over time, analyzed trends, and discussed why schools care about these admissions metrics.
Moving from the abstract to the concrete, we’ll now give you five tips for how to increase your chances of getting into one of the elite national universities we discussed in this article.
Tip 1: Show Your Passion in Your Application
Ideally, your college application will tell a story about what kind of student you have been (and suggest what kind of student you will be).
As PrepScholar co-founder Allen Cheng writes in his article on how to get into Harvard and the Ivy League, highly selective national universities care more that you demonstrate your passion for one subject than your ability to be well-rounded.
Rather than aiming for diversity within each student, Ivy League-caliber schools aim for diversity among students. Practically speaking, this means that instead of showing elite universities that you can do anything and everything well enough, you need to show them that you can do a few things really well and are really interested in those things.
Tip 2: Aim for High Test Scores and a Standout High School GPA
Universities who regularly receive a high volume of applications use standardized test scores (mostly SAT/ACT) and GPA as filters to decide which applications to even read through at all.
Going through tens of thousands of applications is simply not practical when the majority of students are submitting their applications early January and expect to hear back by mid- to late-March.
Even Caltech, with its ~8,400 applications, would have to go through over 110 applications a day between the date applications are due and when students get notified. When you consider the existence of non-workdays and the fact that admissions officers “need sleep because they’re not undead,” it makes sense that schools use test scores and GPAs as filters.
Yes, it hurts to feel like you’re being reduced down to a few numbers. But on the other hand, that means that there are a few clear indicators of success that you can aim for.
Tip 3: Take Rigorous Courses Related to Your Interests
Highly selective schools care almost as much about what classes you take as about how well you do in them.
This doesn’t mean that you have to take every difficult course in your school, but you should take the most rigorous courses that fit in with the narrative of your application.
For instance, if you’re applying to schools with the narrative that you’re a math nerd who loves working on solving p vs np in her spare time, schools will look a little askance at you if you’re taking the easiest math and physics courses at your school, even if you’re taking advanced English or History classes.
A real-life example of this is a high-school friend of mine, M, who took rigorous courses in all subjects throughout high school, including AP Calculus BC in junior year. When M got to her senior year, she had a choice of taking AP Statistics (the only other math class available to her) or Film and Media Studies, which was a non-honors level English class that involved analyzing films.
Because M was so deeply passionate about film (she’d started a film club at our school), she decided to take the non-honors English class instead of a math class senior year. Now, granted, she still was taking AP Spanish, AP Bio, AP Macroeconomics, and AP English Lit, so she was still pursuing advanced coursework in the areas that interested her (and ended up taking the equivalent of two English classes); however, the fact remains that M didn’t take a math class senior year…and still got accepted early decision to UPenn.
To figure out what advanced coursework makes sense for you (and what is unnecessary), we strongly recommend reading our blog articles on what and how many APs Ivy League schools require and what high school classes in general Ivy League schools like to see on students’ transcripts.
Tip 4: Strive for Quality, Not Quantity in Your Extracurriculars
Just as you should focus your academic rigor in the areas that most interest you, you should also focus your extracurricular time on the activities that match up best with your interests.
When it comes to non-academic activities (music, sports, community service, and so on), you want to aim for quality over quantity and dedication over broadness. Even if you don’t end up pursuing the interests you had in high school in colleges, showing that you are capable of focus and dedication to excellence in a particular area will help your college application.
Consider the following two hypothetical students. Candidate A participated in Math Olympiad in your school for one year and in math club a different year. Colleges are not likely to find this super inspiring, even if the student has excelled in her math classes otherwise.
On the other hand, consider Candidate B, who was captain of her high school fencing team for two years (after two years on the team). Even if this student doesn’t go on to fence in college, the fact that she was willing to put the time and energy into sticking with the same thing for four years (and took a leadership role as captain for two of those years) makes her a better candidate than candidate A.
Tip 5: Ensure All Parts of Your Application Are Top-Notch
While test scores, GPA, course rigor, and extracurriculars are usually the most important factors for applications to Ivy League or other top-tier national universities, you can still affect your chances with stand-out letters of recommendation, personal statements, and application supplements or portfolios.
A strong letter of recommendation from a teacher who’s seen you grow as a student, a well-written personal statement that reveals something not evident elsewhere in your application, or an impressive portfolio of work (whether oil paintings or web apps) give schools more points of data for whether or not they should accept you.
 This admissions officer cannot believe how secure the web apps you’ve developed are. Or he’s floored by the fact that you can levitate your computer. Either way, impressive!
What’s Next?
Now that you’ve had a look at the admission rates for these elite universities, you might be wondering what kind of test scores you need to get in. We tell you what good scores are for Ivy League schools plus MIT, Stanford, and UChicago here.
You know how these schools compare acceptance- and yield-wise, but what about across other dimensions like student satisfaction and graduation outcomes? Find out what our current Ivy League Rankings are and what those rankings really mean in this article.
If you’re a student athlete, your path into top-tier colleges might be slightly different from what we’ve described in this article. Learn more about Ivy League athletic recruiting in this article.
Looking for a detailed guide on how to be one of the < 10% accepted to Ivy League Plus schools? Read PrepScholar co-founder Allen Cheng’s reflections on his college application and tips for how you can get into Harvard and other Ivy League-level schools.
Thinking about applying to a smaller liberal arts college instead? We have articles on the top liberal arts schools in the country as well as how to figure out what to go to college for (hint: if you’re undecided, a liberal arts school might be a good call).
Want to improve your SAT score by 160 points or your ACT score by 4 points? We’ve written a guide for each test about the top 5 strategies you must be using to have a shot at improving your score. Download it for free now:


Source: blog.prepscholar.com